

Studying Scientific migration with Big (scholarly) Data
Exploratory: Migration studies
Scientific migration has aroused growing interest in recent years due to its impact on governments' policies and institutions. We analyse the traits of highly-skilled people who emigrate to understand the movements' factors. Also, we focus on the evolution of researchers' collaborative network by measuring the tendency to collaborate with researchers belonging to institutions of the same country of affiliation or not and relating it to changes in affiliation to find out the factors related to scientific mobility.
To model the scientific migration, we collect scholarly data from the Microsoft Academic Knowledge Graph (MAKG) (http://ma-graph.org/), obtaining a feature-rich and stable dataset ranging from 1980 to 2019 - about 209,750,000 papers, 250,500,00 authors, 25,400 affiliations, 48,650 journals. Thus, we build the ego network for each author of papers and calculate the Yearly Degree of Collaborations' Internationality (YDCI) starting from the binary entropy of co-authors' affiliations. So, the score represents the tendency of a researcher to collaborate with researchers belonging to institutions of the same country of affiliation or not. We group researchers based on their YDCI score, affiliation-related information, and publications' year by performing a clustering analysis with K-Means. We identify three different categories of researchers:
- researchers who tend to collaborate in tiny teams working in the same country;
- researchers who tend to collaborate with colleagues working in other countries;
- researchers who tend to collaborate with colleagues working in the same country.
We find that the geographical position of the researchers' affiliation and the years of publications are not discriminating factors to describe the identified groups. Since the researchers included in the first group do not perform relevant movements, we focus on the second and third groups. Thus, we look at changes in collaboration's tendency over time from a geographical perspective. We calculate the average of researchers' YDCI scores both by country and by county for decades.
Figure 1 shows the map obtained by considering researchers who collaborate with colleagues working in other countries, while Figure 2 shows the map for researchers who collaborate with colleagues working in the same country. We can see that America, both south and north, Europe, and Australia show similar but opposite YDCI tendencies. The most extreme tendencies towards collaboration (or not) with foreign countries are in the African and Asian continents.
.jpg)
Figure 1: Map of YDCI by country of researchers who tend to collaborate with colleagues working in other countries.
.jpg)
Figure 2: Map of YDCI by country of researchers who tend to collaborate with colleagues working in the same country
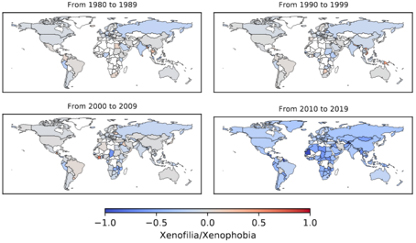
Figure 3: Map of YDCI by countries for decades for researchers who collaborate with colleagues working in other countries.
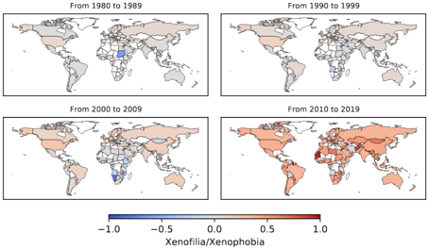
Figure 4: Map of YDCI by countries for decades for researchers who collaborate with colleagues working in the same country.
Finally, we relate tendencies in YDCD with five worldwide events:
● the Černobyl' disaster (1986);
● the fall of the Berlin Wall (1989);
● the dissolution of the Soviet Union (1991);
● attack on the Twin Towers (2001);
● the 2008 Economic crisis (2008).
From Figure 5, we see that some countries (e.g., Russia and Portugal) seem to show a relation (more or less strong) between some important events and the trend of YDCI. On the contrary, others (e.g., Italy and the USA) do not seem to show this relation. These results suggest that major socio-political events may also have effects on scientific migration and collaborative networks.
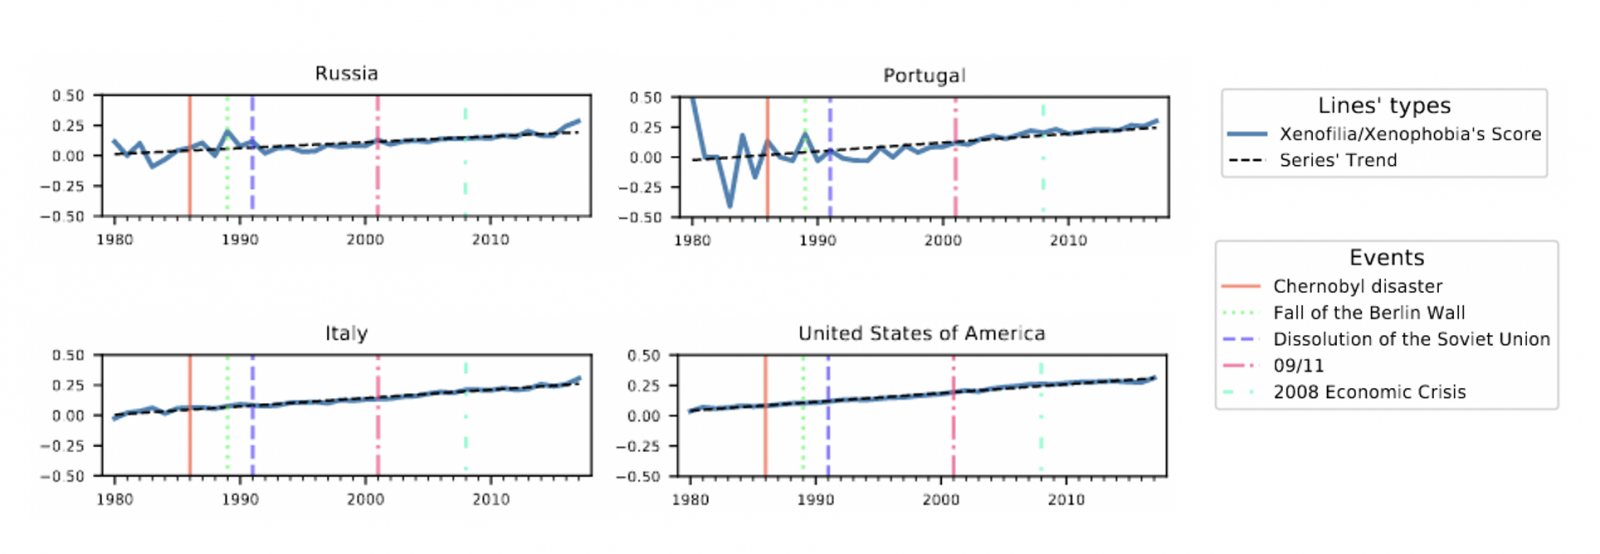
Figure 5: Relation between worldwide events and tendencies in YDCI for Russia, Italy, Portugal, and USA
Written by: G. Ricciarelli, L. Pollacci, L. Milli, and G. Rossetti
Revised by: M. Bohm, L. Pollacci, L. Pappalardo