

Understanding peacefulness through the world news
Could data science help measure peacefulness and understand the factors that influence it? Could we anticipate the level of peacefulness before official sources publish their estimations?
Recently, we have presented a study [1, 2] that demonstrates how using Global Data on Events, Location, and Tone (GDELT) and applying machine learning techniques we can predict the Global Peace Index score (GPI) [5]. GPI captures the peacefulness of the world at a yearly level. Therefore, we show how news data from GDELT help capture GPI at a monthly frequency, anticipating the yearly index value.
To expand our understanding of the factors that influence the present and future peacefulness we use the SHapley Additive exPlanation (SHAP) methodology [3, 4]. In particular, we apply SHAP methodology to provide model transparency on the factors that contribute to higher or lower levels of peacefulness.
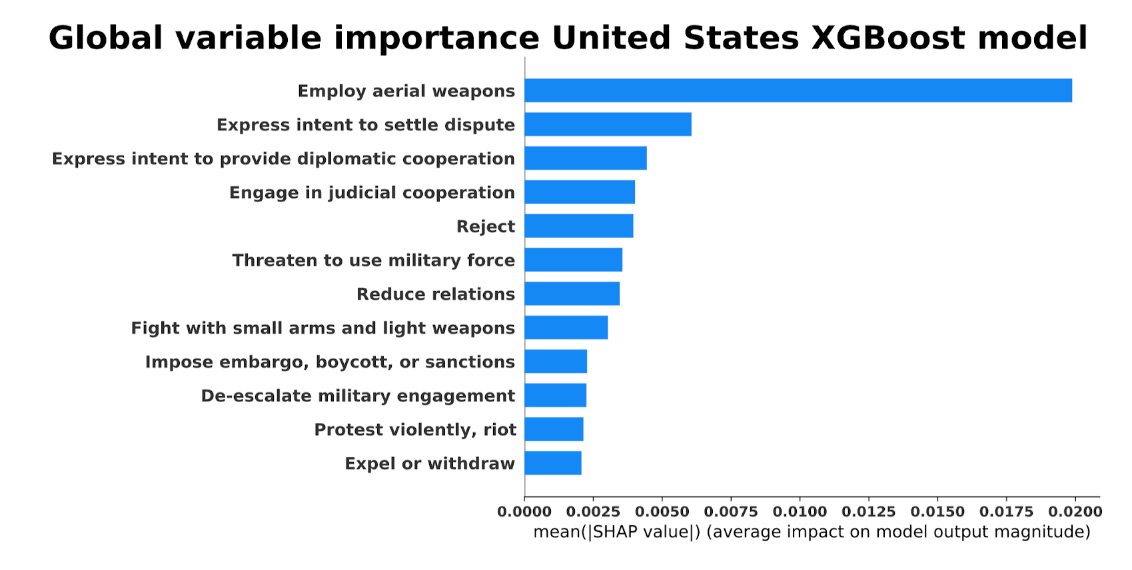
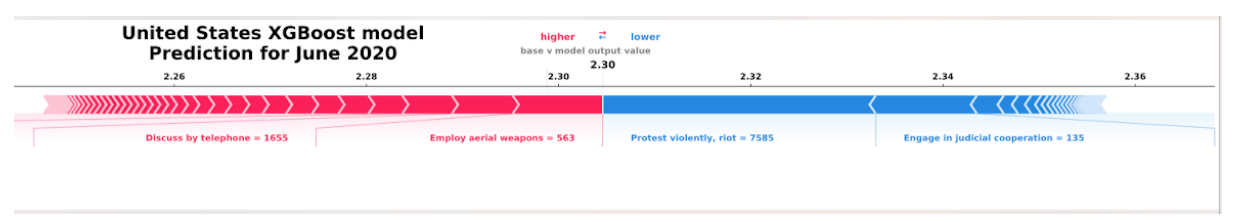
SHAP shows the most important factors that influence GPI at a global level and at a local level. For example, in the United States, the most important factors that contribute to the estimation of GPI, as calculated for the training period between April 2014 and March 2020, indicate a country's profile of a strong player in the military, socio-economic, and political foreground (see Global variable importance plot on Figure 1).
Considering that the global society is under socio-economic and political crisis and instability, policy-makers and peace-builders need to have frequent updates of peacefulness, and of the factors which influence its levels. Additional understanding of peacefulness could empower them to timely react to applying adequate policies, preventing detrimental societal effects, and contributing effectively to social well-being and progress.
[1] V. Voukelatou, L. Pappalardo, I. Miliou, L. Gabrielli, F. Giannotti, “Estimating countries’ peace index through the lens of the world news as monitored by GDELT” Proceedings of IEEE International Conference on Data Science and Advanced Analytics (DSAA2020)
[2] V. Voukelatou, L. Pappalardo “How GDELT is changing how we measure peacefulness?” http://sobigdata.eu/blog/how-gdelt-changing-how-we-measure-peacefulness
[3] Lundberg, Scott M., Gabriel G. Erion, and Su-In Lee. "Consistent individualized feature attribution for tree ensembles." arXiv preprint arXiv:1802.03888 (2018).
[4] Lundberg, Scott, and Su-In Lee. "A unified approach to interpreting model predictions." arXiv preprint arXiv:1705.07874 (2017).
[5] The Institute for Economics and Peace, “VISION of HUMANITY.” http://visionofhumanity.org//, 2017.
Written by: Vasiliki Voukelatou
Revised by: Luca Pappalardo
SoBigData++ Exploratory: Demography, Finance, and Economy 2.0