

Crash Prediction and Risk Assessment with Individual Mobility Network
The massive and increasing availability of mobility data enables the study and the prediction of human mobility behavior and activities at various levels. This month we address the problem of building a data-driven model for predicting car drivers’ risk of experiencing a crash in the mid-term future. Since the raw mobility data, although potentially large, typically lacks any explicit semantics or clear structure to help understanding and predicting such rare and difficult-to-grasp events, this work proposes to build concise representations of individual mobility, that highlight mobility habits, driving behaviors and other factors deemed relevant for assessing the propensity to be involved in car accidents.
The suggested approach is mainly based on a network representation of users’ mobility, called Individual Mobility Networks, jointly with the analysis of descriptive features of the user’s driving behavior related to driving style (e.g., accelerations) and characteristics of the mobility in the neighborhood visited by the user. The most intuitive way to solve the risk assessment problem is to estimate the customer’s risk of having accidents in the near future [2] since high-risk ones are likely to cause the company a loss (paying the costs of her accidents), while low-risk ones are more likely to provide a plain profit. The basic objective is not only to recognize the real risk level of a customer but also to understand possible causes [3]. Hence, in the article we want to propose [1] authors aim to reach two distinct results. First, predicting the customer’s risk score: given a car insurance customer, provide a risk score relative to the near future, e.g., the next year or the next month. We expect this estimate to be much dependent on how the customer drives, as well as on the conditions of the surrounding environment [4]. Accordingly, the methodology proposed is based on the computation of individual driving features, describing how much the user drives and how much dynamically, also related to the general characteristics of mobility in the places that the user visits. The second result pursued is to infer risk mitigation strategies: given a car insurance customer and her risk score, the objective is to identify the characteristics of her driving behavior [5] that determine her risk score. From a prescriptive viewpoint, this is going to provide the customer indications of how to lower down her risk score, with benefits for her (in terms of safety and insurance costs) and the insurance company (in terms of costs for accidents). The approach under investigation queries the predictive models adopted for understanding which features decided for the prediction [6].
Crash risk means probability of accidents, which are statistically rare events. This, together with the lack of a clear set of predictive indicators to adopt, make the risk prediction a very difficult task. Therefore, the proposed approach takes into account several different aspects: individual components of the driving behavior including those that can be derived from IMNs, elements considering the collective mobility of other users, and static contextual information such as road categories and the presence of points of interest. Achieving a good prediction accuracy often conflicts with the understandability of the predictive model. In difficult settings, complex predictors such as deep neural networks can achieve better performances than simpler ones like decision trees, Bayesian classifiers, etc., yet, the formers are usually not human understandable [7]. The aim is not only to provide good predictors for the car crash application but also extracting risk mitigation guidelines for the user, which means understanding which factors made a driver a risky one in order to propose changes in her behavior that can reduce the risk. While that makes simpler models more appealing, authors explore methods for “explainable AI” [3], [8], aimed to extract explanations from not interpretable predictors. Finally, since the various individual mobility models and predictors are expected to be highly dependent on the geographical area under study, a test of the transferability of the models has been done. The models obtained through this approach are transferred from a region to another in order to test the level of transferability.
General Approach
The approach consists in approximating the probability Pcrash(u) in the problem definition in two steps: (i) first, the knowledge contained in the mobility history of the individual is represented through a set of meaningful yet (necessarily) lossy features, then, (ii) the probability function is learned through data-driven models, in particular, standard machine learning predictors. Since an additional objective of risk assessment is to find the possible factors that lead to a crash (whatever the nature of each factor, either causal or simply correlated), two ways to infer the role played by each feature in the classification are adopted. The first one comes as a built-in feature of random forest algorithms, namely the feature importance score, which says how much important is overall a feature, though not describing if that is a positive or negative factor. The second way exploits recent results in the explainable AI domain, in particular, the SHAP method [9], which assigns the positive/negative impact of each feature on every single prediction, allowing to make both single-user and collective considerations. The core of this work lies in the user modeling enabling the classification, i.e., translating the raw yet potentially deep mobility information into a set of features able to capture its significant elements, and in particular those useful for crash prediction.
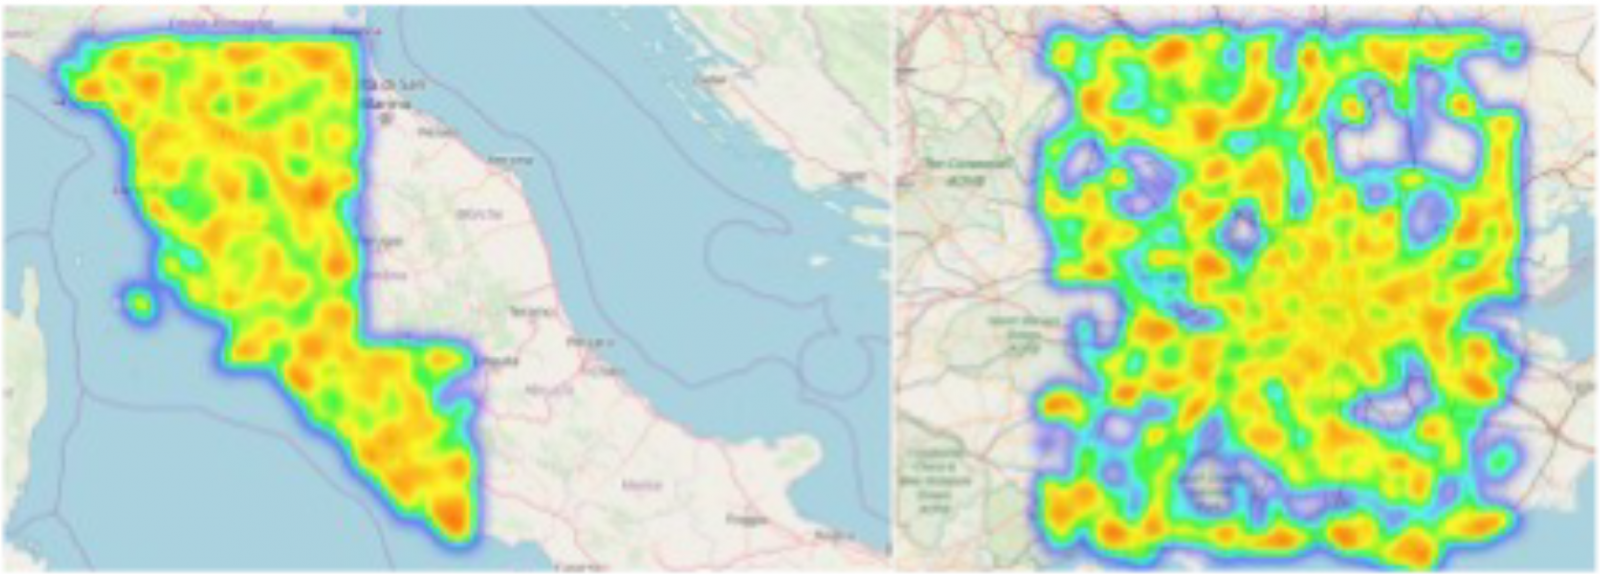
Geographical areas covered by the data under investigation: Tuscany and Rome in Italy (left), and London in UK (right).
It is intuitively clear that the risk of crash might depend on the context where the user drives. For instance, traversing hazardous areas is expected to increase the risk of accidents. In addition, driving habits that might abstractly make her a risky driver (e.g., showing high acceleration rates) could actually be considered good if aligned with the general conditions of her driving environment (e.g., a chaotic area of the city). The geospatial context information mentioned above is very difficult to find in existing data sources. For this reason, some contextual indicators are computed directly from the mobility data, by extracting collective aggregates from the history of all users in the dataset. The process starts by defining a spatial partitioning of the geographical area into small sections. This has been performed through a recursive quadtree division driven by a dataset of Points-of-Interest(PoI): the division stops when the section produced contains a given minimum number of PoI, thus obtaining finer resolutions in areas with many PoIs and coarser ones where they are scattered, e.g., in rural areas.
The paper [1] describing this research has been recently published and it is available here: https://ieeexplore.ieee.org/document/9162285.
Post Written by: Agnese Bonavita
Post Revised by: Luca Pappalardo
References
[1] R. Guidotti and M. Nanni, "Crash Prediction and Risk Assessment with Individual Mobility Networks," 2020 21st IEEE International Conference on Mobile Data Management (MDM), Versailles, France, 2020, pp. 89-98, doi: 10.1109/MDM48529.2020.00030.
[2] Y. Wang et al., “Machine learning methods for driving risk prediction,” in SIGSPATIAL Workshop. ACM, 2017, p. 10.
[3] R. Guidotti, A. Monreale, S. Ruggieri et al., “A survey of methods for explaining black box models,” ACM CSUR, vol. 51, no. 5, p. 93, 2019.
[4] Y. Ba, W. Zhang, Q. Wang, R. Zhou, and C. Ren, “Crash prediction with behavioral and physiological features for advanced vehicle collision avoidance system,” TR-C, vol. 74, pp. 22–33, 2017.
[5] R. Trasarti, F. Pinelli, M. Nanni, and F. Giannotti, “Mining mobility user profiles for car pooling,” in SIGKDD. ACM, 2011, pp. 1190–1198.
[6] D. Pedreschi et al., “Meaningful explanations of black box ai decision systems,” in AAAI, vol. 33, 2019, pp. 9780–9784.
[7] A. A. Freitas, “Comprehensible classification models: a position paper,” ACM SIGKDD explorations newsletter, vol. 15, no. 1, pp. 1–10, 2014.
[8] A. Adadi et al., “Peeking inside the black-box: A survey on explainable artificial intelligence (xai),” IEEE, vol. 6, pp. 52 138–52 160, 2018.
[9] S. M. Lundberg and S.-I. Lee, “A unified approach to interpreting model
predictions,” in NIPS, 2017, pp. 4765–4774.