

Healthy Twitter discussions? Time will tell
As the volume of online content and discussions grows, the amount of misinformation grows with it. The most extreme type of misinformation (content created with malicious intent), which includes fabricated or manipulated data, can be automatically identified in certain domains (e.g., bot detection, image deep fake analysis) and is the target of extensive research. On the other hand, less explicit types of misinformation (harmful content not necessarily produced for that purpose), such as misleading, biased, or incomplete content, are much harder to characterise or label, and its characterisation remains an open challenge. Moreover, this sort of misinformation is hard to quantify, as ground truth labels are typically unavailable.
The SARS-CoV-2 pandemic illustrated how complicated it can be to identify informative debates in a context of uncertainty and how necessary a tool is for aiding consumers in managing the overflow of information they are subject to. This context raises the following questions: What discussions can be considered healthy? Do healthy discussions have any specific patterns or properties? Is it possible to define some formal criteria for the healthiness of online discussions?
HPAI group from Barcelona Supercomputing Center has aimed to get closer to the answers to these questions. We have summarised our preliminary findings in an Arxiv paper, outlining them here.
For answering these questions, we collected more than 829 million tweets from the early COVID-19 pandemic period. We gathered tweets belonging to a given thematic conversation (a topic) within this collection by defining a set of keywords specific to such a theme. We used COVID-19-related controversies, misinformation topics, and rumours from Poynter's COVID-19-related misinformation database (https://www.poynter.org/ifcn-covid-19-misinformation/) for this.
For further analysis, we characterised these topics by looking solely at the volume and time of their activity, i.e. their temporal dynamics, as shown in Figure 1.
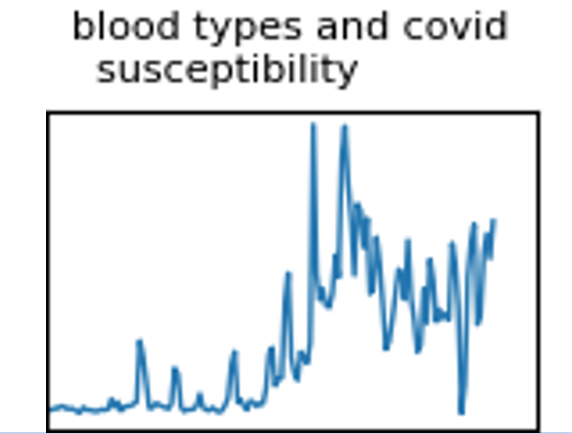
Figure 1: Example of the daily number of tweets mentioning the different blood types in relation to COVID-19.
Given these topic representations, we clustered them based on their similarity, trying to identify the main characteristics that make some topics different from others. For this, we have experimented with different distance measures, such as the sum of absolute differences, adaptations of Kolmogorov-Smirnov statistics and Hellinger distance, and the norm of the difference of squares (NDS). The latter proved to be the most promising in terms of results:
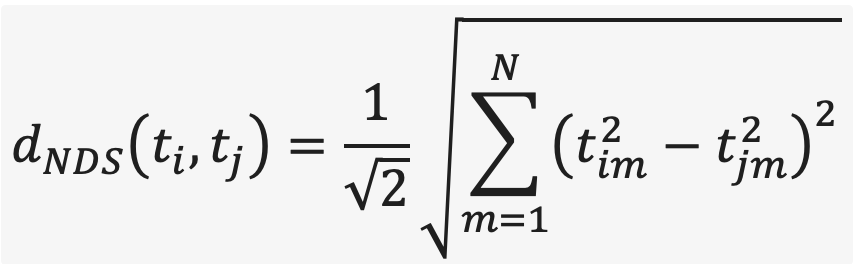
where ti and tj are topics and tim denotes the normalised frequency value of the topic for mth day.
Moreover, their numeric representations needed to be aligned for proper comparison of topics, removing dependency on the exact dates. After experimenting with various ways of alignment, we found that the pairwise exhaustive enumeration of different alignments to find the one giving the best similarity is time-consuming but works much better than other methods. However, given the small size of topic vectors, the enumeration time cost, albeit noticeable, is still small, making it a preferred method in this case.
Next, under the hypothesis that the ephemerality of conversations is related to their quality, we formalised different measures of ephemerality and then computed their values for the gathered topics. The first one considered was a direct adaptation of the measure originally proposed to estimate the ephemerality of YouTube videos. It is equal to the length of the period containing 90% of the topic in terms of the number of tweets. Of the remaining 10%, half is pruned from the beginning of the topic vector and half – from its end. We call it ephemerality 2. It essentially shows the duration in real-time of the topic being discussed on Twitter (although it is prone to detecting as lowly ephemeral topics that have long gaps between short peaks of activity). An alternative way of computing ephemerality is to sort all the daily tweet counts for the topic and calculate the length of the period to accumulate 90% of tweets, starting from the highest tweet count. We call it ephemerality 4. This way, we forego the actual time duration of the corresponding topic and focus on whether it was discussed uniformly in time. As the results and applications of these two ephemeralities complement each other, we propose the approach to analysing the general behaviour of discussion shown in Figure 2.
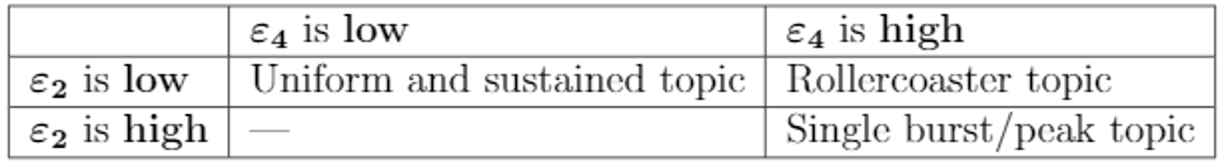
Figure 2: The shape of the topic's frequency vector based on the ephemerality values.
Lastly, we explored the relationship between the ephemerality measures and the unsupervised clusters. Our results applying the HDBSCAN clustering method for topics' NDS distances with exhaustive alignment indicate that ephemeral topics represent a big family of short-lived and burst-like discussions (unlikely to be informative). In contrast, non-ephemeral topics correspond to sustained, persistent and argued discussions that last on time (with the potential to be informative and healthy). These findings are consistent with clusters found by the HDBSCAN algorithm, with an outliers group consisting of topics with more exotic temporal shapes. Examples of these clusters are shown in Figure 3.
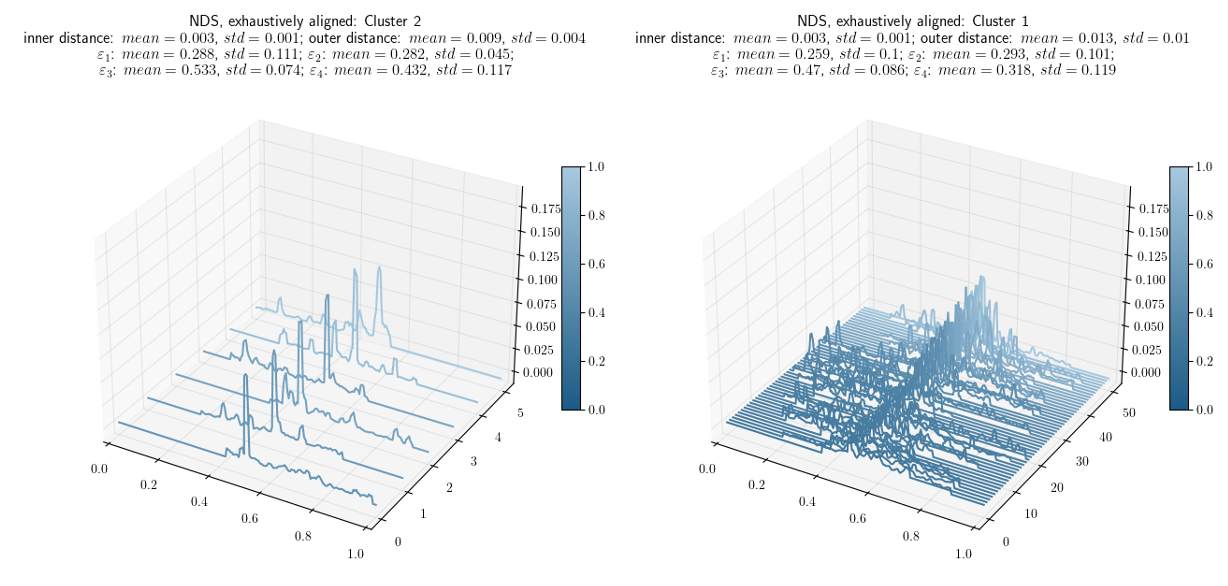
Figure 3. Clusters examples. The single peak cluster is on the left, and the uniform cluster is on the right. Both are aligned by the highest peak. The cases that are more borderline between the two are drawn paler and closer to the background.
You can find more details of the research in the full paper at: https://arxiv.org/abs/2203.11261
Author: Dmitry Gnatyshak, BSC
Exploratory: Societal Debates and Misinformation Analysis
Sustainable Goals:
- 3. Good Health and Well-being
- 4. Quality Education
- 16. Peace, Justice and Strong Institutions