

Information dynamics of price and liquidity around the 2017 Bitcoin markets crash
Cryptocurrencies are a novel financial instrument, whose uniqueness lies in a novel distributed ledger technology that serves as a public database of executed transactions. They are also characterised by high price fluctuations, price bubbles, and sudden price crashes. Cryptocurrencies can be traded (sold and bought) at many independently operating venues (exchange markets), however, the price of a cryptocurrency eventually synchronises as the traders take advantage of mismatches between prices, as observed by a single asset in several markets, or exploiting several assets within one market. Therefore, the universal price of a cryptocurrency is also determined in a distributed fashion, depending on trading decisions within each individual market and trades that occur in between markets.
In addition to data, available within a market (e.g. recent transaction volumes, amount of bid and ask orders, etc.), the price changes may also “respond” to “exogenous information”, in the form of social media mentions, news, as well as “inter-market information” - the market information outside the trading venue (e.g. observing the difference between current market price in some two venues allows a trader to perform arbitrage), see figure 1.
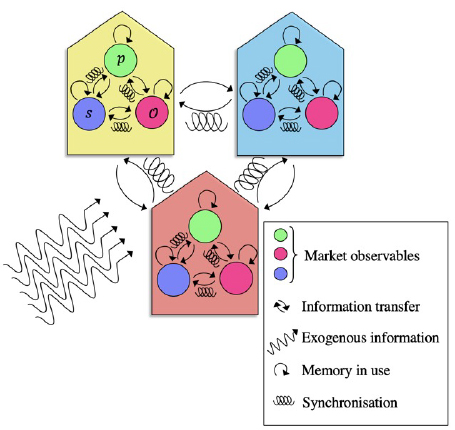
Figure 1. Each market is characterised by a set of market microstructure observables (nodes of the same colour illustrate the same observable). We consider information transfer and synchronisation between observables of the same type (here: same colour), and between observables of different types (here: of different colours) as well as the internal memory each process has.
Although at low frequencies, the prices of Bitcoin in different markets develop in apparent synchrony, the law of one price does not hold at very high frequencies. Therefore, by analysing the system at high frequency bands we can detect and quantify the strength of different influences which precede the changes in price. Such functional coupling and its changes seem to be particularly important during turbulent periods, which in financial systems may be price bubbles. Cryptocurrencies, which are not backed by other assets (and therefore have no intrinsic values) are primarily priced according to the supply and demand, which is reflected in the limit order books, as well as executed transactions. It is not clear, however, what information sources are the strongest drivers in the system: does liquidity cause changes in price, or is it the change in transaction patterns? The reverse may also be true: the appreciated price may cause a surge of selling behaviour, as well as to reduce market liquidity. Often, these multiple influences lead to very large fluctuations (high volatility in technical terms) of exchange rates between cryptocurrencies and fiat money, price bubbles, and sudden price crashes. These properties make cryptocurrencies exchange rates a unique laboratory to empirically study the collective dynamics leading to market instabilities, which are well known to be ubiquitous in all financial markets.
To deduce the importance of different types of information sources (exogenous beyond the system of markets, exogenous across markets, endogenous within each individual market), we analyse entropy constituents of the high-frequency data from the largest Bitcoin exchange markets. An entropy of a time-evolving signal (time series) can be decomposed into several information dynamics constituents, namely transfer entropy, active information storage, and intrinsic uncertainty. Transfer entropy measures how much uncertainty about a target variable’s future can be deduced given the knowledge of the current state of a source variable, over and above the current state of the target variable. Active information storage measures the amount of shared information between the current state of the variable itself and its future. The intrinsic uncertainty is the remainder of the variable’s entropy that is not deductible from any other variable (in the dataset and beyond it). In addition to entropy decomposition, we also consider multi-information, which measures the amount of non-lagged synchronisation amongst a set of variables.
We describe each market in terms of a set of time series that reflect the state of market makers and market takers in each minute, namely, spread s (the difference between the best bid and best ask prices), price returns r (the change in market price between two consecutive time steps), and order imbalance O (the difference between the volumes of bought and sold Bitcoin within each minute). We then compute the information flows (transfer entropy), active information storage, multi-information within each market across different observables, and across different markets.
Using information dynamics tools, we ask the following questions:
-
How much information is communicated across markets and how much within a market?
-
Is this system’s communication is primarily lagged (e.g., a change in price is first observed in Market 1 at time t, and then in Market 2 at time t+1, or a change in price in Market 1 at time t leads to a change in spread in Market 1 at time t+1), or is it synchronous (e.g., a change in price occurs synchronously across markets as a result of an exogenous effect such as news)?
-
In case of a turbulent event, do the information dynamics patterns change?
We first study several econometric models that couple market microstructure variables and analyse whether a particular coupling and its (sudden or slow) change are detectable with information dynamics tools. We then analyse the persistence of information dynamical patterns that signify a particular regime shift and use them to interpret the information dynamics patterns across markets during one turbulent event in the crypto-market ecosystem, namely, the Bitcoin bubble in 2017-18. We remind that the bubble occurred in December 2017 when Bitcoin price went up from around 6,463$ on the 1st November, 2017 to, at that time, an all-time-high of 19,716$ on the 17th of 11,414$ before the end of the year, descending for weeks and months afterwards, see figure 2 for the price evolution. Assuming that high frequency market data related to Bitcoin traded against dollar and Tether in 10 largest trading venues captures the majority of the dynamics that took place at that time, we concentrate our attention on information dynamics within and across markets using this particular set of data.
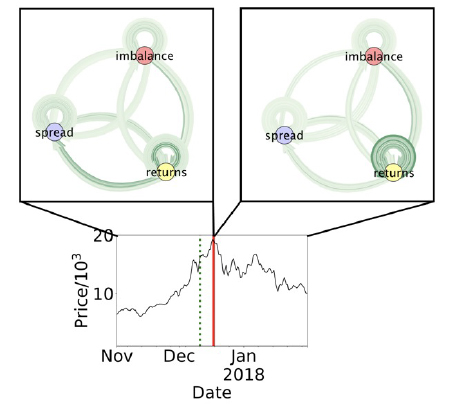
Figure 2. Top: directed multi-graphs of information flow between the three market observables before the price crash (left) and after the price crash (right). Saturation of edges indicates the strength of information transfer. Self-loops represent transfer entropy from one market to another when considering the same observable. Bottom: the mid price evolution in the pre- and post- crash periods.
By contrasting two states of the system (the pre-crash and post-crash), we find that the system as a whole shifted from a high-coupling regime to a low-coupling regime. First, active information storage decreased for all variables: while the system was highly predictable from its own past, it was less so in the post-crash period. In terms of synchronisation, we found that within-market synchronisation amongst different observables (price returns, order imbalance, and spread) decreased after the crash. We also found that the across-market synchronisation decreased. These two results suggest that the system became less synchronised and less predictable. It may also indicate that such a system is susceptible to various types of perturbations, however we leave such a hypothesis for further research.
By considering information transfer, we found that there was a strong link, before the crash, from price returns to spread within markets, while this link dissipated post-crash. We did not find such strong links for order imbalance. Lastly, inter-market connectivity for spread variables decreased dramatically post-crash, while inter-market connectivity for price returns increased. On a high-level, it suggests that there was a dramatic change in the system’s behaviour - a regime flip. Since, most often, we observed a simultaneous increase (c.f. decrease) of all three information dynamics measures, we hypothesise that such regime shift could have occurred due to change in implicit dynamics. We base our conclusion on an observation of such a signature in a model of coupled vector autoregressive processes where the change in systems intrinsic uncertainty is varied. See table 1 for summary.
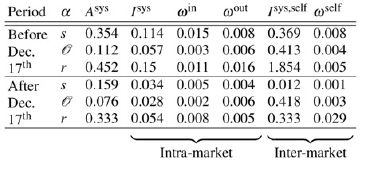
Table 1. Amount of memory (Asys), synchronisation (Isys for synchronisation within market, and Isys,self for inter-market synchronisation), apparent information transfer between market microstructure observables per possible link (wself for inter-market information flow and win/out for the strength of information flow, incoming and outgoing, within a market) for each market microstructure observable. All values are in nats. The first section of the table shows values obtained from time series before the market crash, and the second shows values after the crash. For all observables except for wself in r all types of information sharing and use of information in the past decreased post-crash.
Exploratories: Demography, Economy & Finance 2.0.; Social Impacts of AI; Explainable Machine Learning.
Link in the SoBigData Catalogue
Author: Vaiva Vasiliauskaite, ETHZ