

Quantifying the presence of air pollutants over a road network in high spatio-temporal resolution
The estimation of air pollutants’ distribution over space is a significant challenge that concerns climate change and human health. Greenhouse gas (GHG) emissions from the transport sector have more than doubled since 1970, and about 80% of this growth has come from road transport [1]. In 2016, 11.9% of global GHG emissions were from road transport (60% of which from passenger travel and 40% from road freight) [2]. Moreover, the transport sector emits non-CO2 pollutants such as nitrogen oxides (NOx), which lead to the formation of ozone and particulate matter (PM), and volatile organic compounds (VOCs). These pollutants, emitted by internal combustion engines, play a fundamental role in changing climate and are severely dangerous for human health [1]. Among the Sustainable Development Goals to be reached by 2030 [3], the United Nations poses an urgent call for action to reduce “the adverse per capita environmental impact of cities, paying special attention to air quality” [3]. In this regard, understanding how air pollutants emitted by vehicles distribute in a city is fundamental in designing policies to reduce transportation emissions.
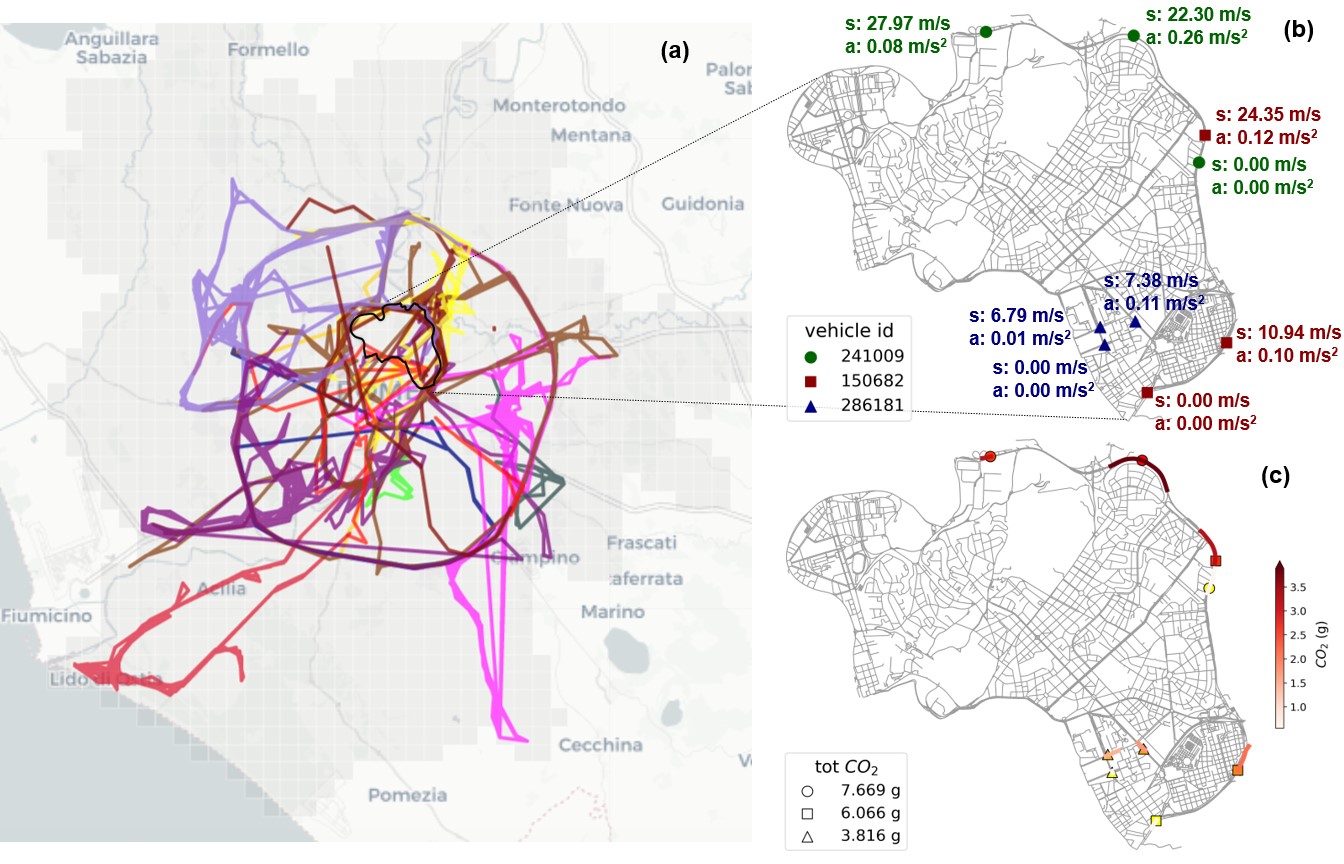
Figure 1. Computation of emissions from GPS trajectories.
(a) Visualisation of the trajectories of 20 vehicles travelling during January 2017 in Rome. Each colour indicates a different trajectory. The grey area indicates the territory of the municipality of Rome. Plot generated with Python library scikit-mobility. (b) Visualisation of the GPS points of three vehicles passing through a neighbourhood in Rome. Each symbol and colour indicates a different vehicle; for each point we show the corresponding instantaneous speed and acceleration. The point with zero speed and acceleration is the first point of the trajectory sample. (c) The instantaneous emissions of CO2 of each GPS point and for each road crossed. The points and the roads are coloured in a gradient from white (low emission) to red (high emission). The legend shows the overall quantity of emissions of each vehicle.
In this post we present a study of the emissions of four air pollutants (carbon dioxide, nitrogen oxides, particulate matter, and volatile organic compounds) coming from thousands of private vehicles moving in three different European cities - Rome, London, and Florence - throughout January 2017.
In particular, we use trajectories generated by onboard GPS devices, match them to the cities' road networks, and exploit information about the vehicles' fuel type to implement a microscopic model [4,5] that computes the emissions produced by the vehicles (Figure 1).
We find that, for all three cities, emissions are distributed across vehicles in a heterogeneous way: a few vehicles, that we call gross polluters, are responsible for a tremendous amount of emissions. At the same time, most of them emit significantly less. Also, a few grossly polluted roads suffer from a significant quantity of emissions, while most of them suffer significantly fewer emissions. Both the distributions of emissions across the vehicles and across the roads are well approximated by heavy-tailed distributions (Figure 2).
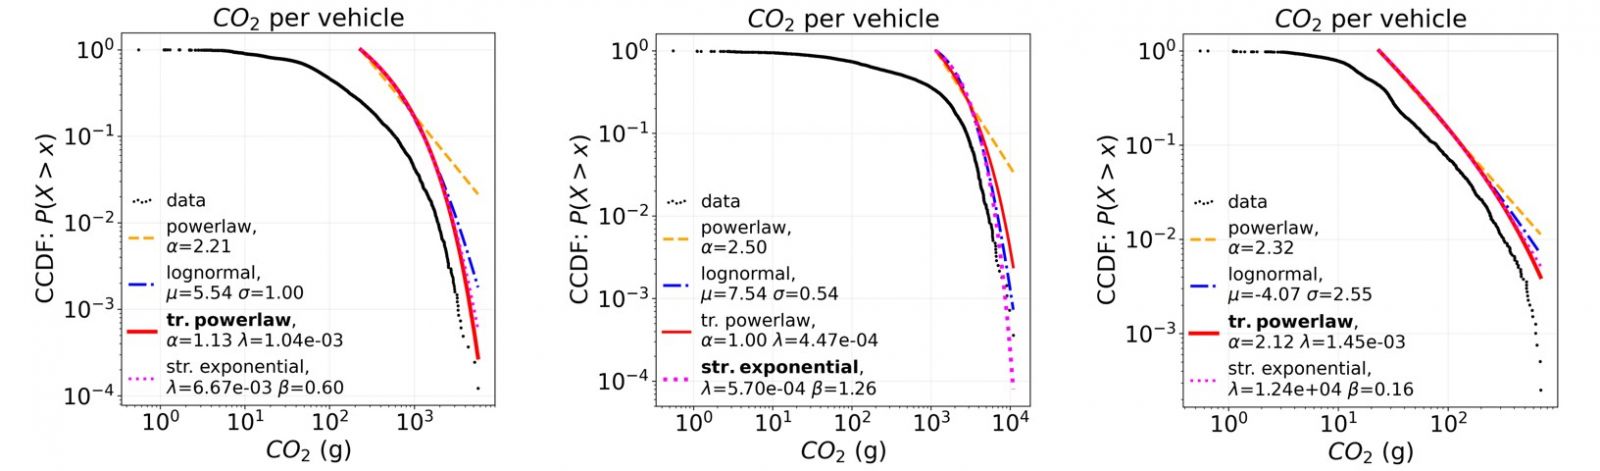
Figure 2. The distribution of CO2 emissions across the vehicles in Rome (left), Greater London (center), and Florence (right).
Each of the three figures show, on a log-log scale, the Complementary Cumulative Distribution Function (CCDF, black dots) of the CO2 emissions per vehicle in a city, together with four heavy-tailed models that were fitted to the data (the power law, log-normal, truncated power law, and stretched exponential), and the best fit highlighted in bold in the legend.
We also investigated the relationship between a vehicle's emissions and its mobility behaviour, from one side, and between the emissions suffered by a road and its network features, discovering that gross polluters tend to be more regular and predictable in their mobility than low-emitting vehicles (Figure 3), and confirming that the most polluted roads are the ones that fall more frequently on the shortest paths connecting two nodes of the network.
Finally, as reducing emissions is a growing concern for cities, and estimating the impact of policies targeting vehicles to reduce their footprint on the city’s environment is crucial, we investigate the impact that (i) the vehicles’ electrification and (ii) the home working have on the total amount of CO2 emissions and the distribution of emissions across the roads. We find that, for example, the electrification of just the top 1% gross polluters moving in Rome would lead to the same reduction of the CO2 emitted overall as electrifying 10% random vehicles, and that the remote working of the top 1% gross polluters would lead to the same reduction reached if they were ∼4% random vehicles. Similar results hold for the other cities, even if with slightly lower numbers for London.
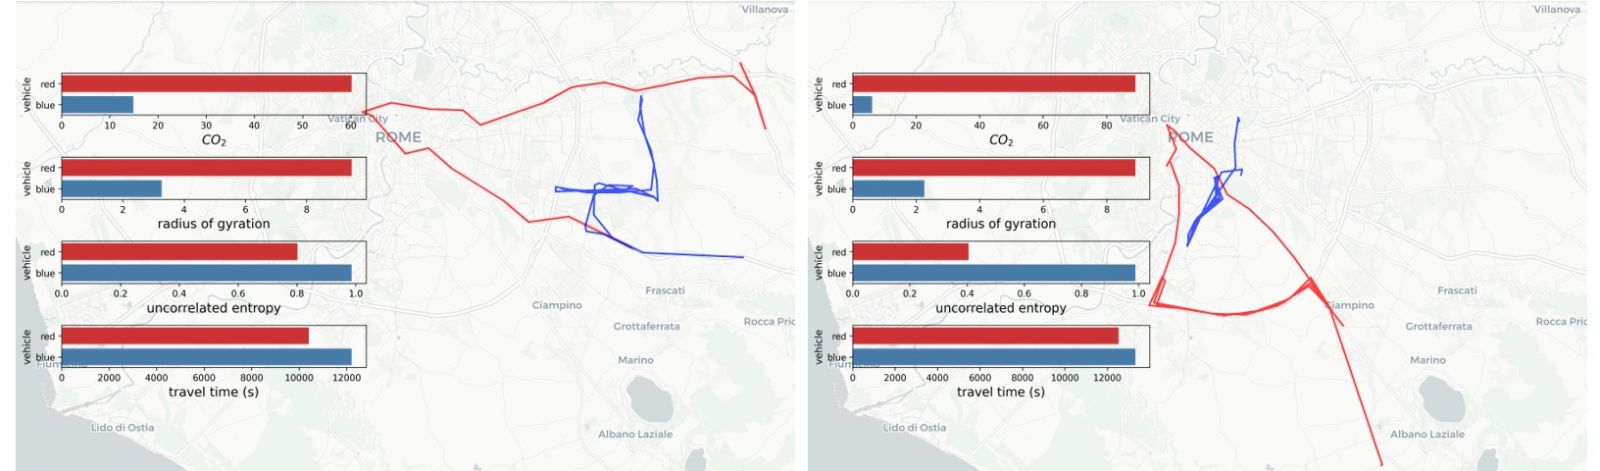
Figure 3. The relation between mobility behaviour and emissions.
Two examples (one on the left and the other on the right) in which we show one vehicle that has high radius of gyration and low entropy (in red) and another vehicles that has low radius of gyration and high entropy (in blue): even if the travel time of both is perfectly comparable (see last bar plot), the difference in terms of overall CO2 emissions is not negligible (see first bar plot).
A preprint paper version of this work, with more details, can be found at https://arxiv.org/abs/2107.03282.
Author: Matteo Böhm
Exploratory: Sustainable Cities for Citizens
References
[1] Intergovernmental Panel on Climate Change. Climate Change 2014: Mitigation of Climate Change: Working Group III Contribution to the IPCC Fifth Assessment Report, chapter 8, page 599–670. Cambridge University Press, 2015. Available at https://www.ipcc.ch/report/ar5/wg3/.
[2] H. Ritchie. Sector by sector: where do global greenhouse gas emissions come from?, 2020. Available at https://ourworldindata.org/ghg-emissions-by-sector.
[3] United Nations General Assembly. Transforming our world: the 2030 agenda for sustainable development. Technical Report, 2015. Accessed: 2021-02-23. Available at https://sdgs.un.org/2030agenda.
[4] M. Nyhan, S. Sobolevsky, C. Kang, P. Robinson, A. Corti, M. Szell, D. Streets, Z. Lu, R. Britter, S. R. Barrett, and C. Ratti. Predicting vehicular emissions in high spatial resolution using pervasively measured transportation data and microscopic emissions model. Atmospheric Environment, 140:352 – 363, 2016.
[5] J. Liu, K. Han, X. M. Chen, and G. P. Ong. Spatial-temporal inference of urban traffic emissions based on taxi trajectories and multi-source urban data. Transportation Research Part C: Emerging Technologies, 106:145 – 165, 2019.